On July 14, 2026, the forecast for the Twin Cities called for red, unhealthy air. Two days later, smoke from the Boundary Waters fires had pushed the metro into maroon, the Hazardous category, a level the Minnesota Pollution Control Agency had never issued for the Twin Cities before.
Don't take a swing like that for granted! Smoke you can barely see can change your family's air faster than a once-a-day check will catch. It also explains why the AQI Minneapolis number on your phone may not match the state forecast page or a federal database. Each one runs on its own clock, and once you know which clock you're reading, the 24-hour trend gets much easier to trust.
TL;DR Quick Answers
AQI Minneapolis
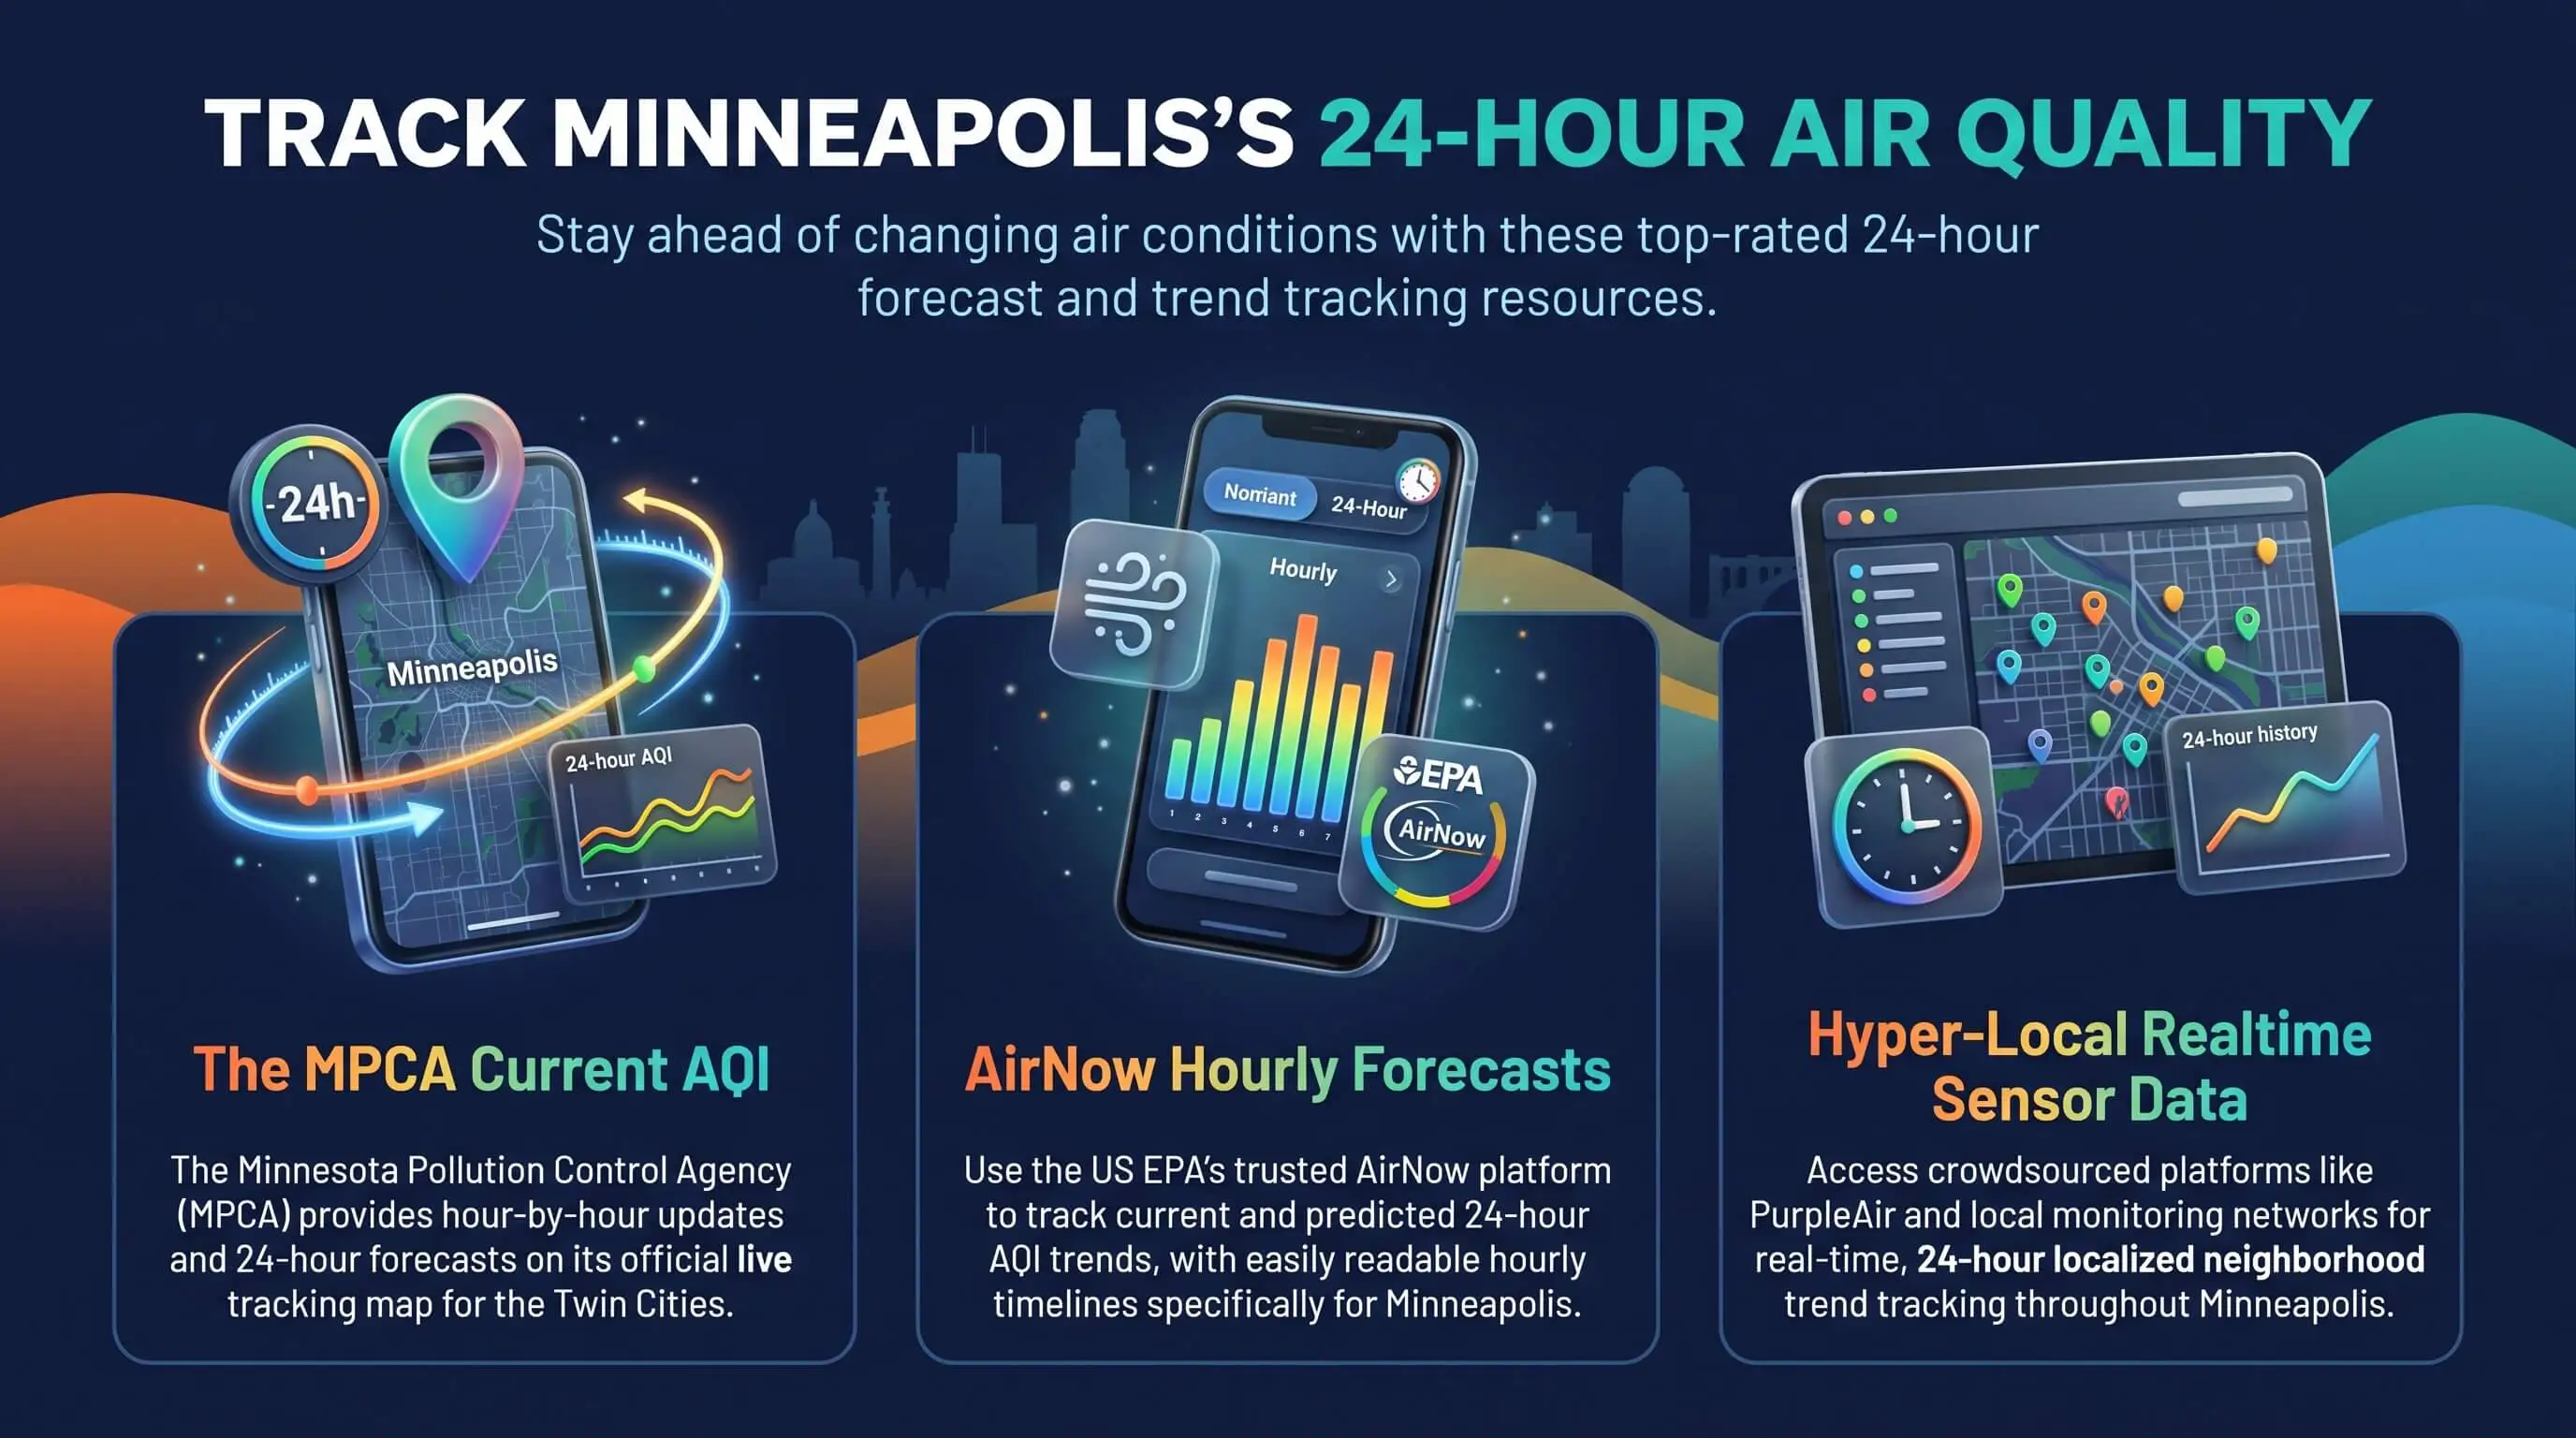
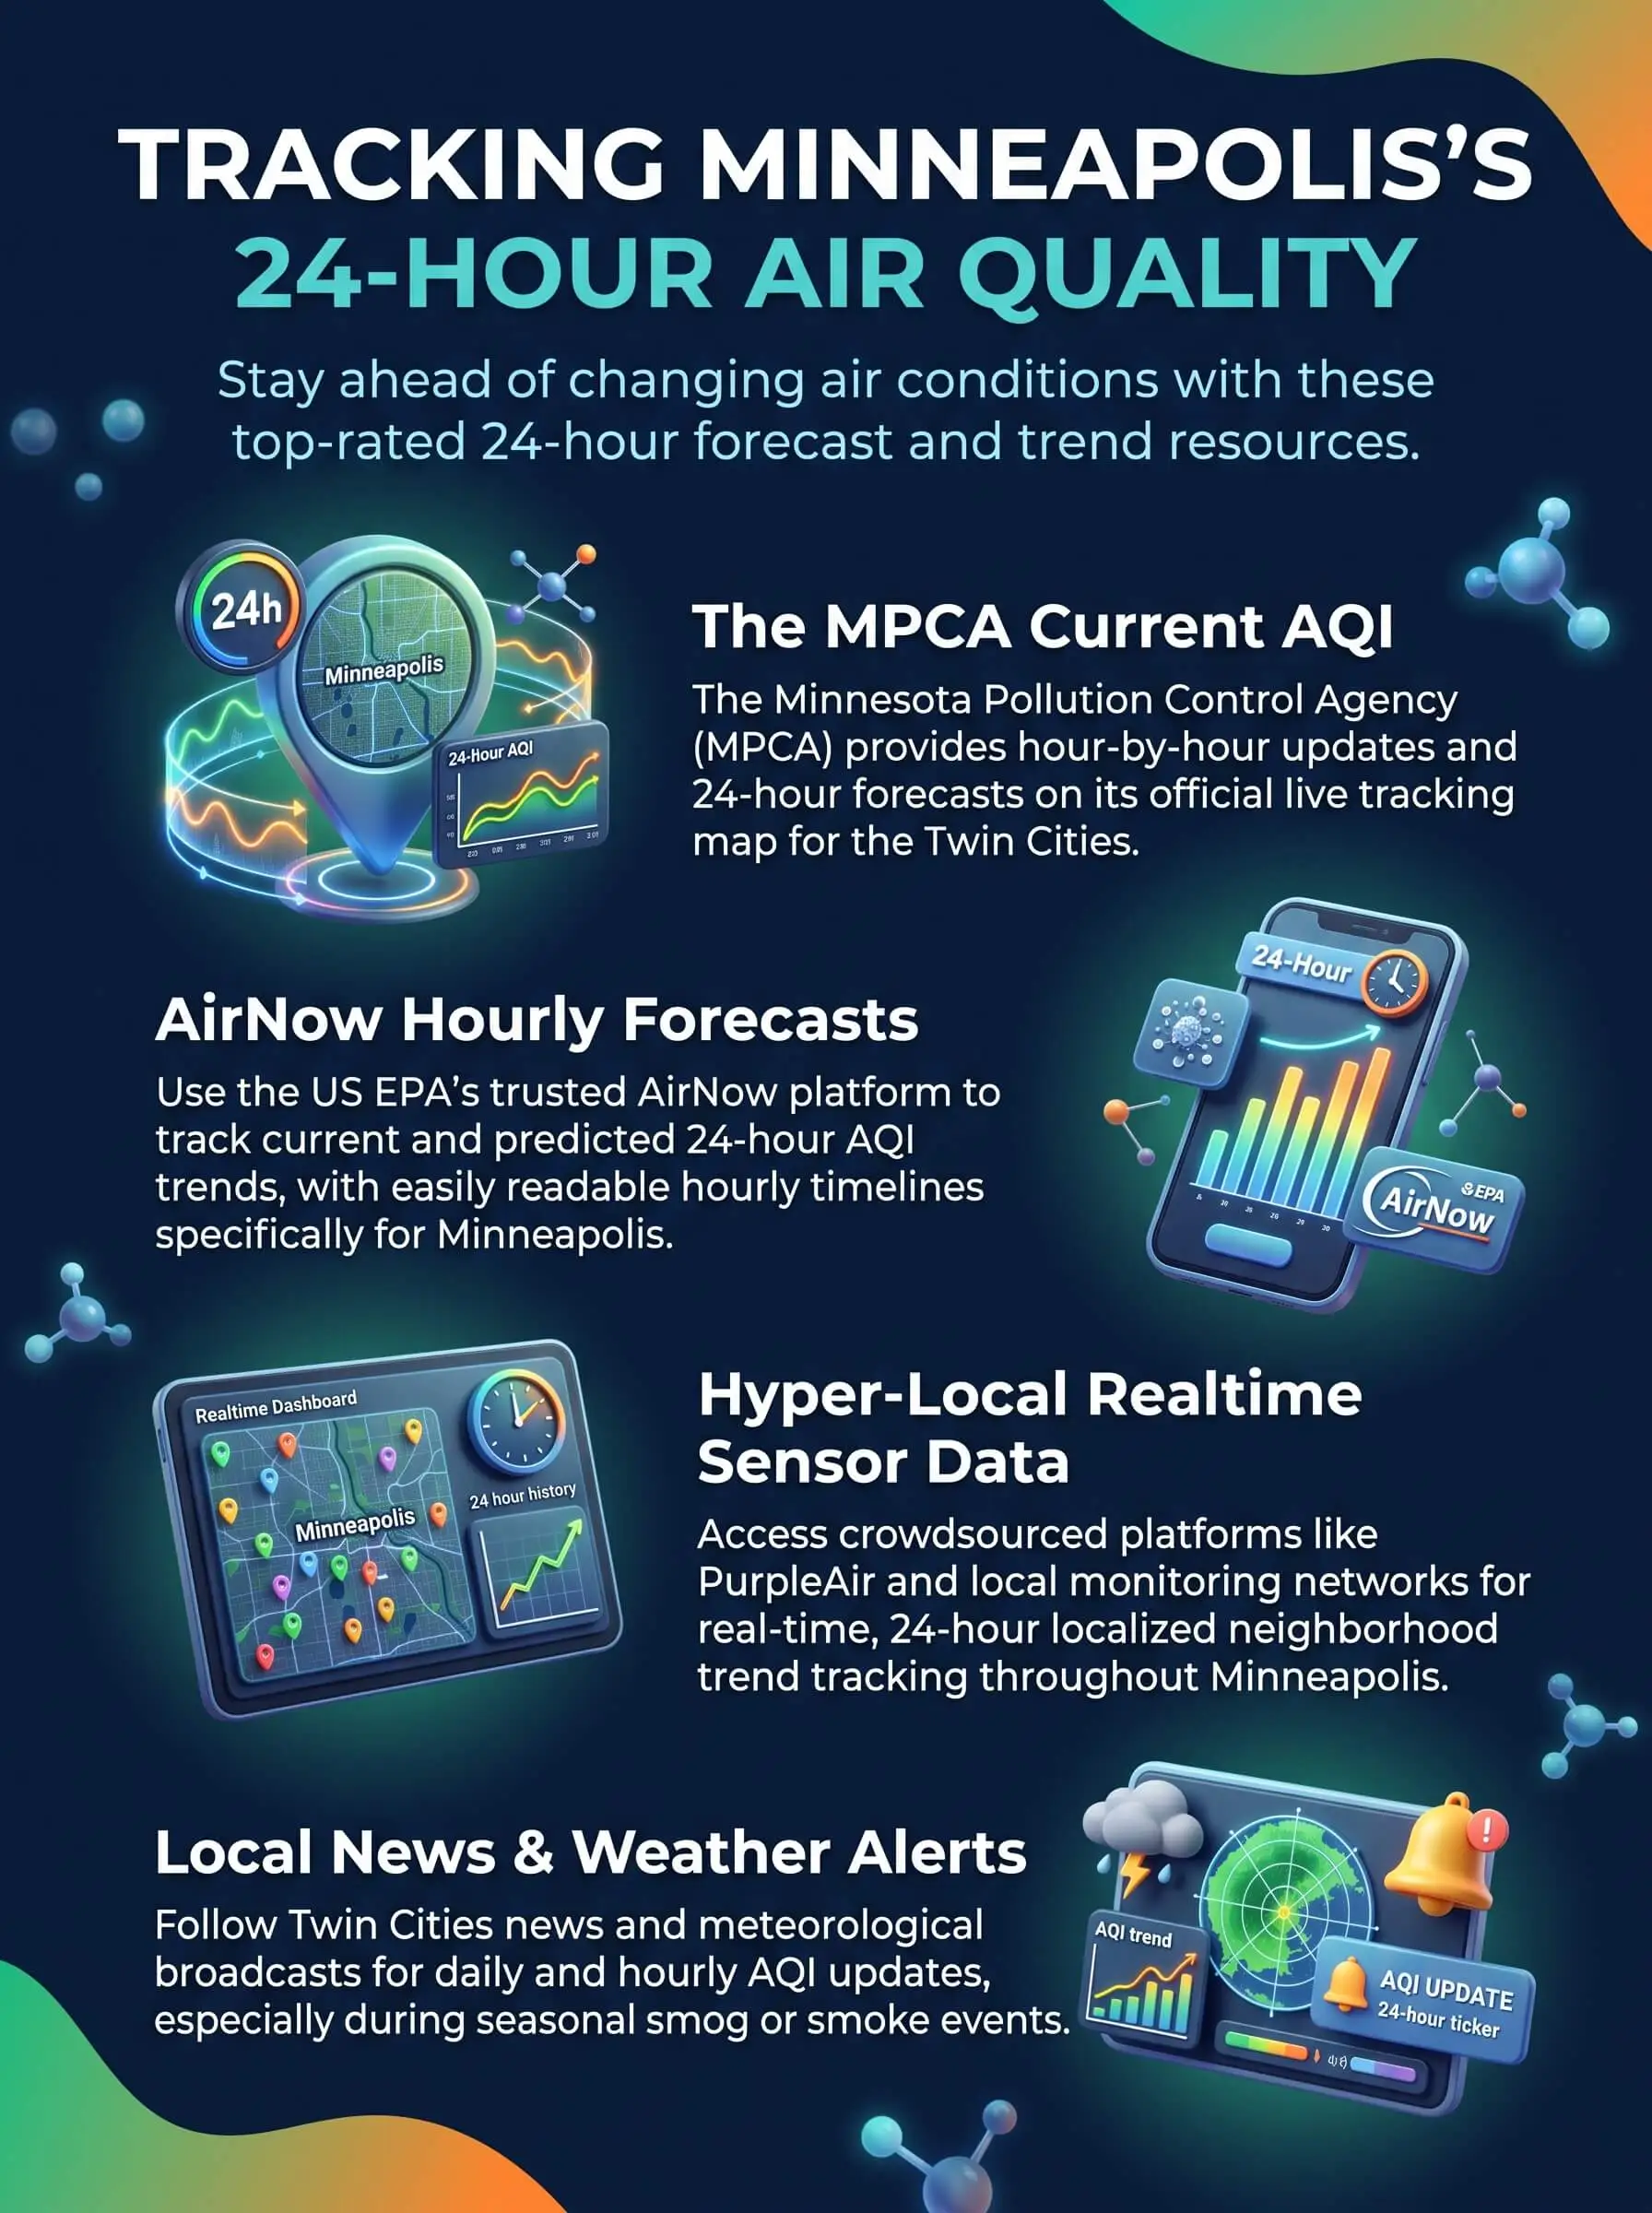
AQI Minneapolis readings run on two clocks. Most apps show the NowCast, an hourly estimate that leans on the newest readings. The official daily AQI averages all 24 hours and settles after midnight. Pair a live map for right now with EPA and MPCA data for the full-day record and tomorrow’s forecast.
Right now: A live map or the AirNow app updates every hour and names the pollutant driving the number.
Smoke days: The AirNow Fire and Smoke Map adds corrected sensors and shows whether the air near you is improving or getting worse.
Past days: The EPA AQI Daily Values Report lists final daily AQI values for Hennepin County and the Minneapolis-St. Paul metro.
Tomorrow: The Minnesota Pollution Control Agency (MPCA) posts a daily forecast and issues alerts when air is expected to reach orange (101+) or worse.
At home: When the hourly line climbs toward orange, close the windows and set your furnace fan to On. Check the filter after red or purple days. A carbon filter helps reduce smoke-related odors and certain gases that may enter your home during periods of poor air quality.
Top Takeaways
Two clocks, two honest numbers. The hourly NowCast and the 24-hour daily AQI can disagree, and both can be right.
Pair your sources. Use a live map for the next few hours and EPA or MPCA data for the full-day record and tomorrow's forecast.
Smoke moves fast. In July 2026, the Twin Cities went from ordinary air to Hazardous in about a day.
Indoor air follows outdoor air. Close up early and check your filter after red or purple days.
Why Two Minneapolis AQI Numbers Can Disagree
The AQI runs from 0 to 500 across six color bands, green for Good up to maroon for Hazardous. Every pollutant on that scale has its own averaging period, a detail built into how the U.S. AQI scale works. Fine particles, called PM2.5, make up most wildfire smoke and winter haze. Their official period is a full 24 hours.
NowCast Gives You the Hourly Number
Waiting a whole day to learn the air was bad helps nobody. The EPA's answer is NowCast, a weighted average of up to the last 12 hours of readings that leans hardest on the newest hours when conditions shift fast. AirNow's dial shows it. So do most live maps, and they refresh it every hour.
Daily AQI Gives You the Full-Day Record
The official daily AQI for particles averages all 24 hours, so nobody can calculate it until the day ends. A smoky afternoon can post a red NowCast and still close out the day in orange, and neither number is wrong.
Where to Track AQI Minneapolis Trends Hour by Hour and Day by Day
I keep two bookmarks, one hourly source and one daily source. Between them, they answer almost every outdoor question my household asks.
A Live Minneapolis AQI Map for the Next Few Hours
Make a live AQI Minneapolis map your first stop each morning. It shows the current reading, the pollutant behind it, and plain guidance for every color, so you can decide in seconds whether the morning run happens or the windows stay shut. The color-coded scale makes AQI meaning easier to understand, helping you quickly identify pollution levels and make safer choices for your daily activities.
AirNow and the Fire and Smoke Map for Smoke Days
Here's something that might surprise you. AirNow's main dial shows whichever pollutant leads at monitors that state and local agencies pick, and on a summer day that can be ozone while smoke is already drifting in. Once the sky turns hazy, open the Fire and Smoke Map instead. It combines permanent monitors with thousands of corrected low-cost sensors and tells you whether the air near you is improving or getting worse.
MPCA Forecasts and Alerts for Tomorrow
The MPCA posts a daily AQI forecast and sends an alert whenever it expects orange or worse. Sign up for its emails, and tomorrow's air lands in your inbox the evening before.
EPA AirData for Yesterday and Last Year
Was last Tuesday really as bad as it felt? The EPA's AirData reports will tell you. They list final daily AQI values by county and fill recent days with AirNow data until certified numbers take their place.
City of Minneapolis Sensors for Neighborhood Patterns
The city runs its own sensor network, and you can filter its data by neighborhood back to summer 2022. Updates come weekly. That makes it a history tool rather than a live feed, and it's the best way to see whether a block along a freeway corridor runs dirtier than one near the lakes.
How Minneapolis Air Changes Across a Day and a Season
Winter inversions. On calm, frigid nights, warmer air sits on top of colder air like a lid and holds wood smoke, furnace exhaust, and traffic particles near the ground until the wind picks back up.
Summer ozone. Sunny afternoons cook vehicle and industrial emissions into ground-level ozone, so readings often climb as the day goes on.
Wildfire smoke. This one moves the fastest. Shifting winds can turn a green morning red within hours, and a cold front with northwest winds often clears it out, which is exactly how relief reached the metro in July 2026.
Rain helps less with smoke than most people hope. This look at whether rain improves air quality in Wisconsin shows why.
Reading the Trend Before It Reaches Your Home
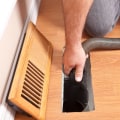
Outdoor air finds its way inside through small gaps and fresh-air intakes. Once it reaches the return duct, your furnace or air conditioner carries it into every room. Outdoor air finds its way inside through small gaps and fresh-air intakes. A regular filter change is one of those habits, helping your HVAC system capture airborne particles and maintain cleaner indoor air.
You're the one who can get ahead of that, and four habits make it simple.
Check twice a day. Morning and late afternoon catch most of the big swings.
Follow the directions. A 90 that's climbing deserves more attention than a 110 that's falling.
Close up early. Once the hourly line heads toward orange, shut the windows and set the furnace or air handler fan to On so your filter keeps catching particles.
Check the filter after red or purple days. Fine particles that slip past a loaded filter settle in your ductwork, which is one reason regular duct cleaning matters for indoor air quality.
"After years of answering smoke-day calls across the Twin Cities, I've learned to treat the outdoor number as a head start. In the homes I've worked in, smoke usually reaches the living room a few hours after the outdoor reading turns orange, because a furnace fan on Auto pulls that air through the return and across whatever filter sits in the slot. That climbing hourly line buys you time to close up, switch the fan to On, and check the filter before the smoke settles into the ducts."
7 Essential Resources
1. See Smoke Near Your Block With AirNow's Wildfire Guidance
When the Fire and Smoke Map beats the main dial, and why their numbers differ.
Source: https://www.airnow.gov/fires/using-airnow-during-wildfires
2. Look Up Any Past Day in the EPA AQI Daily Values Report
Pull daily AQI values for Hennepin County or the whole metro, for any year on record.
Source: https://www.epa.gov/outdoor-air-quality-data/air-quality-index-daily-values-report
3. Compare Neighborhoods on the City of Minneapolis Air Dashboard
Neighborhood sensor history since 2022, updated weekly, plus a page that counts days above health standards.
Source: https://www.minneapolismn.gov/government/government-data/datasource/air-monitoring-dashboard/
4. Plan Kids' Outdoor Time With Minnesota Department of Health Guidance
The state's guide links each AQI level to how much outdoor activity makes sense for children.
Source: https://www.health.state.mn.us/diseases/asthma/schools/outdoorair.html
5. See How the National Weather Service Builds Air Quality Forecasts
NOAA and the EPA produce daily ozone and particle forecasts together, and this page shows how.
Source: https://www.weather.gov/safety/airquality
6. Learn Who Needs Extra Care From the CDC
Children, pregnant people, and anyone with asthma, COPD, or heart disease top the CDC's list of people most affected by smoke.
Source: https://www.cdc.gov/wildfires/risk-factors/index.html
7. Trust Sensor Readings With the PurpleAir Correction Study
Researchers Karoline Barkjohn, Brett Gantt, and Andrea Clements found raw low-cost sensor data ran about 40 percent high, then built the correction federal smoke maps use today.
Source: https://amt.copernicus.org/articles/14/4617/2021/
3 Statistics
1. Orange Alerts Jumped From 7 to 37 in Five Years
The MPCA issued 7 orange-category air quality alerts in 2018. In 2023 it issued 37, plus 12 in the red category.
What it means for Minneapolis: A daily look at the trend belongs in your routine now, right next to the weather.
2. A Blaine Sensor Hit 342.8 µg/m³ in July 2026
During the July 14 to 17 smoke outbreak, the state climatology office reported that a sensor in Blaine set a new Twin Cities record for fine particles by a wide margin.
What it means for Minneapolis: A once-a-day check can miss the moment the air turns hazardous.
Source: https://www.dnr.state.mn.us/climate/journal/extreme-smoke-july-2026.html
3. The Twin Cities Earned an F for Short-Term Particle Pollution
The American Lung Association's 2026 State of the Air report ranked the metro 39th worst in the nation for daily particle spikes. Hennepin County averaged 4.5 unhealthy days a year.
What it means for Minneapolis: The risk lives in the spikes rather than the yearly average, and only an hourly trend shows them.
Source: https://www.lung.org/media/press-releases/fy26-sota-minnesota
Minneapolis has faced a sharp rise in air quality alerts, with orange-level alerts increasing from 7 in 2018 to 37 in 2023. During July 2026, wildfire smoke pushed fine particle pollution to record levels in the Twin Cities. The region also ranked 39th worst nationwide for short-term particle pollution, showing why regular AQI checks matter. Along with monitoring outdoor air quality, high quality filters that capture fine particles help reduce indoor exposure to pollution during wildfire smoke events and unhealthy air quality days.
Final Thoughts and Opinion
I stopped trusting a single AQI reading a while ago, and after July 2026 I don't think anyone in Minneapolis should rely on one. The air here changes too fast for snapshots. The 24-hour line shows where your day is heading, and pairing one hourly source with one daily source turns those mismatched numbers into something you can use. Once you know which clock each source runs on, the disagreements start working for you.
I'd also keep a spare furnace filter on the shelf from late spring through early fall. That small habit makes you the one who was ready before the smoke showed up.
Frequently Asked Questions
Why Does the AQI Minneapolis Number on My Phone Differ From MPCA's?
Most phone apps show the hourly NowCast, while the MPCA forecast predicts the whole day ahead. Some apps also lead with ozone during smoke, so check the pollutant and time period before you compare.
What Is the NowCast AQI?
NowCast is how the EPA estimates current air quality each hour. It averages up to 12 recent hours and gives the newest ones extra weight when conditions change quickly. AirNow's live dial runs on it, and so do most real-time maps.
How Do I See Yesterday's AQI for Minneapolis?
Open the EPA's AQI Daily Values Report. Pick the pollutant, the year, and Hennepin County or the Minneapolis-St. Paul metro, and it returns a daily AQI for every date.
How Fast Can Minneapolis Air Quality Change During Wildfire Smoke?
Faster than most people expect. In July 2026, the metro went from fairly normal air to maroon, the Hazardous category, in about a day. An hourly trend catches that turn.
Does the City of Minneapolis Sensor Dashboard Show Real-Time AQI?
No. The city's dashboard holds historic data from summer 2022 onward and updates weekly. For today's plans, check a live map or the AirNow app.
When Does Minnesota Issue an Air Quality Alert?
The MPCA sends an alert when it forecasts orange, Unhealthy for Sensitive Groups, or anything worse. You can get those alerts by email.
Know Which Minneapolis AQI Number You Are Reading
Reliable 24-hour AQI trends for Minneapolis start with matching each number to its clock, whether that's the hourly reading for right now, the daily record, or tomorrow's forecast. Check the live map each morning, glance again before evening plans, and let the trend instead of a single reading decide when your windows open. When outdoor pollution rises, a MERV 13 filter in a compatible HVAC system helps capture fine particles that enter your home.